
On August 30, an article titled "Salaries in Small Counties Across Jiangsu, Zhejiang, and Shanghai Have Begun to Collapse" trended online. It recounted something the author heard last month while having dinner with a friend in a county-level city under Nantong's jurisdiction.
His friend spent five years in mechanical design, with a monthly salary that had been stable at 8,000 yuan. This year, the factory saw most of its export orders slashed, and wages were cut directly to 5,000 yuan. Quarterly and year-end bonuses were eliminated entirely, and half of the frontline workers were laid off. In the friend's own words: "Before, I could at least save up for a down payment. Now, after social insurance deductions, I barely have enough to cover food, and I'm close to defaulting on my mortgage."
The article added a supplementary note, clarifying that the situation is not confined to that one county. The author had recently visited several county-level cities and discovered that wages in many small counties had already collapsed—with the declines even more dramatic than the salary plunges seen in major cities.
I half believe that claim.
In a county-level city under Nantong, a mechanical designer's clients are mostly local equipment manufacturers and parts suppliers—precisely the cohort that has taken the hardest hit from collapsing export orders over the past two years. With orders gone, design roles, being non-frontline, are the easiest to trim. A salary cut from 8,000 yuan to 5,000 yuan, a reduction of nearly 40%, with bonuses wiped out on top, is hardly unusual in the county factories of Jiangsu and Zhejiang.
However, using a friend's salary to represent the salary of an entire province is not feasible. One person's salary reduction may be related to the industry, the specific factory, or the particular position. The term "collapse" is also used too loosely; if it's truly a collapse, it should be a universal, continuous, and irreversible decline.
Household income data for Jiangsu and Zhejiang provinces in the first half of 2026 shows wage income still growing in nominal terms. Zhejiang's per capita disposable income for all residents reached 39,807 yuan, up 5.3% year-on-year. The figures are rising, though at a slower pace than in previous years.
The gap between perception and statistics is what needs to be explained.
So this article is taking a different approach, not counting how many friends have taken a pay cut, as there are countless such cases and it's hard to give an accurate number.
I want to lay out the industrial structure of southern Jiangsu and Zhejiang's county economies piece by piece: where their products go, where they sit in the supply chain, how much tariffs and freight costs have risen over the past two years, and how badly corporate income statements have been squeezed. Once that's clear, what happens on the wage side needs no guessing.
The bottom line: wages in Jiangsu and Zhejiang counties haven't collapsed, but they're stuck—wedged in an awkward position. Exports are still rising, but profits have already taken a hit, and profits are what feed wages upstream.
$10,200, the profit from an entire cabinet just vanished
On August 20, 2026, a freight forwarder quoted rates of $6,500 for a 20-foot container and $10,200 for a 40-foot container for shipments from Shanghai to Jeddah, Saudi Arabia, transshipped via Port Klang, Malaysia.
This price is not yet locked in, according to a freight forwarder who accepted an interview, and there is still a possibility of receiving new price increase notices before the ship sets sail on September 1.
Half a month ago, the freight rate for 40-foot containers on some Middle Eastern routes was still around $7,000. By late August, the transshipment rates for destinations such as Kuwait Port, Umm Qasr Port, Umm Qasar Port, and Saudi Dammam had also successively broken through $10,000.
To fully grasp the scale of this round of price increases, you need to look at the entire picture.
On August 21, the Shanghai Export Containerized Freight Index stood at 3409.63 points, up 1.62% week-on-week and 140.9% year-on-year. By route, the freight rate from Shanghai Port to the Persian Gulf basic port was $5,729 per TEU, up 5.66% week-on-week and 287.36% year-on-year, the highest since data became available in 2009.
To the US West Coast, the price reached $6,765, up 311.5% year-over-year;
to US East $9,700, up 271.22% year-on-year;
To South America, $7,805, up 151.21% year-on-year;
to Australia and New Zealand at $2,315, up 82.72% year-on-year;
To Europe at $2,842, up 70.38% year-over-year;
To the Mediterranean at $3,767, up 69.3% year-on-year.
On the same day, freight rates from Shanghai to Japan's Kansai and Kanto regions were $319 and $323, respectively, both unchanged from the previous period.
The same ship leaving Shanghai costs over $300 to go to Osaka, but over $5,700 to go to the Persian Gulf. This price difference itself is a true reflection of this year's foreign trade.
The issue is that with a price tag of $10,000 per container, it's not just the furniture industry that can't afford it.
I have reviewed the monthly operating data released by the Zhejiang Furniture Industry Association over the past several years. Output, revenue, and export delivery value are typically reported as separate line items. From January to June 2026, furniture enterprises above designated size across the province produced a cumulative 154 million units, up 7.0% year-on-year — a solid performance.
Look further down and it changes.
During the same period, furniture enterprises above designated size in the province recorded operating revenue of 59.424 billion yuan, up 2.2% year-on-year, with total profits of 793 million yuan, down 66.2% year-on-year.
Output increased by 7%, revenue rose by 2.2%, and profit plummeted by two-thirds.
The same holds true on a national scale.
On July 27, data released by the National Bureau of Statistics showed that in the first half of 2026, the national furniture manufacturing industry's operating revenue was 257.61 billion yuan, down 8.6% year-on-year, with total profits of 4.57 billion yuan, down 52.7% year-on-year.
The same report showed that the total profit of the non-metallic mineral products industry decreased by 47.8% year-on-year, while the wood processing and wood, bamboo, rattan, palm, and grass products industry saw a decline of 33.7%.
Meanwhile, another key figure for the same period shows that profits of China's large-scale industrial enterprises grew 18.7% year-on-year in the first half of the year. From January to July, the country's exports increased 14.0% year-on-year, and the value-added of large-scale industries rose 5.3%.
These two sets of numbers, written on a piece of paper with a seam in the middle, represent the current situation of a large number of county-level factories in Sunan and Zhejiang.
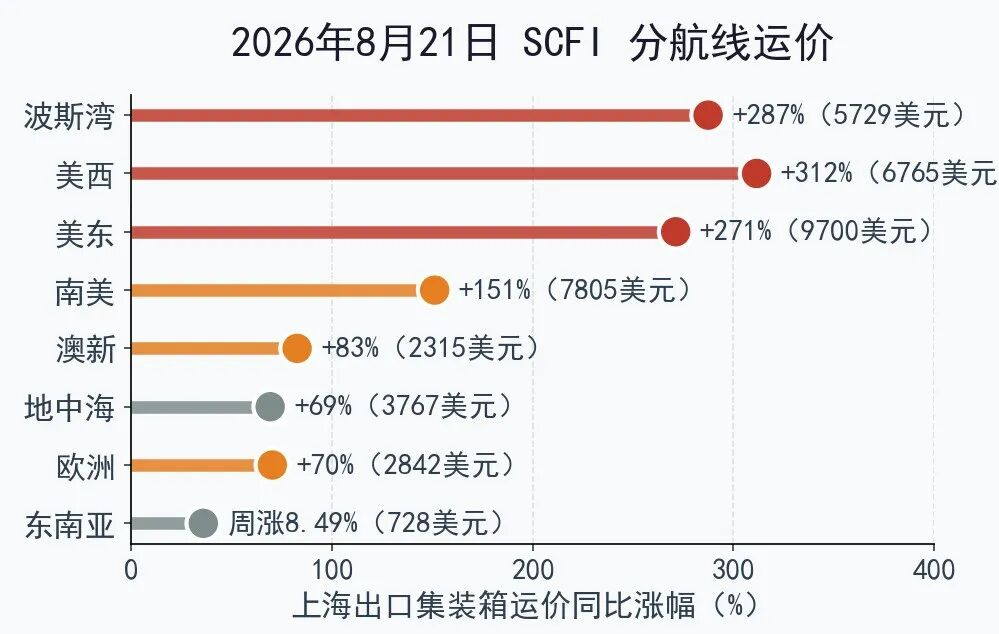
Figure 1: Performance of Shanghai Export Container Freight Index by Route on August 21, 2026
2. Exports Rose 14%. Why Do County Factories Still Have No Orders?
Looking at the broader market, according to statistics from the Hangzhou Customs, in the first half of 2026, Zhejiang's total import and export value reached 2.97 trillion yuan, with a year-on-year increase of 8.6%, of which exports were 2.26 trillion yuan, growing 9.2%. The province's import and export, export, and import scales accounted for 11.7%, 15.4%, and 6.5% of the national total, respectively. Jiangsu performed even more strongly, with an export growth rate of 24.8% in the first half, and its export value was only 1.1 billion USD less than that of Zhejiang.
These numbers don't look like they've "collapsed" at all.
But which part is rising, that needs to be broken down.
From January to June, Zhejiang's high-tech product exports reached 209.66 billion yuan, up 22.5% year-on-year, lifting their share of provincial exports by 1 percentage point to 9.3%. Exports of the "new three items" — electric vehicles, lithium batteries, and solar batteries — totaled 94.97 billion yuan, a 57.7% increase, contributing 18.2% of provincial export growth. Among these, electric vehicle and lithium battery exports both doubled, rising 1.1-fold. Ship and marine engineering equipment exports grew 27.9%, while new materials exports surged 86.3%.
Intelligent bionic robots exported 430 million yuan, accounting for 60.2% of the country's exports of similar products.
The problem lies exactly in this: 9.3%.
This proportion means that for every 100 yuan of goods exported by Zhejiang, only 9.3 yuan is accounted for by high-tech products, with more than 90 yuan still being the traditional products.
Exports are climbing—driven by ships, batteries, and robots. The county-level factories making hardware, knitwear, and fabric sofas have little to do with this wave of growth.
The situation for the traditional three mainstays is best illustrated by home textiles.
From January to June 2026, China's home textile exports to its largest market, the US, reached $5.43 billion, up 13.2% year-on-year and accounting for 32.7% of total exports. That sounds respectable on the surface. But over the same period, US imports of home textiles totaled $5.9 billion, down 12.7% year-on-year. The market itself is contracting, and we're still pushing more product in—at the cost of unit prices and margins.
Zhejiang's home textile exports reached $5.89 billion, accounting for 35.5% of the national total, up 6.2% year on year.
Jiangsu was $34.4 billion, up 3.3%.
In Vietnam, wood and wood product exports reached $8.6 billion in the first half of the year, up 4.9%. This kind of substitution didn't just start this year—it's just that this year, the scale of order diversion has become clearly noticeable.
There is another set of numbers that further illustrates the issue.
In the first half of 2026, China's top three provinces and cities for exports to the US were Guangdong with $67.77 billion, Zhejiang with $42.69 billion, and Jiangsu with $26.56 billion, representing year-on-year increases of 2.0%, 4.6%, and a decline of 17.6%, respectively.
In the same Yangtze River Delta, Jiangsu's exports to the US have dropped nearly 20%, while Zhejiang's continue to rise.
The difference does not lie in tariffs, but in the fact that the two provinces sell different types of products to the United States.
The numbers for private enterprises also need to be looked at separately.
During the same period, Zhejiang's private enterprises reported import and export volumes of 2.46 trillion yuan, up 9.8% year-on-year, accounting for 82.8% of the province's total imports and exports, and contributing 92.7% of the growth in foreign trade. A total of 120,000 private enterprises achieved import and export results, an increase of 17,000 from the same period last year.
Most of the 120,000 are small factories with annual revenue in the tens of millions of yuan.
They contributed 90 percent of the incremental growth while bearing nearly all of the cost increases.
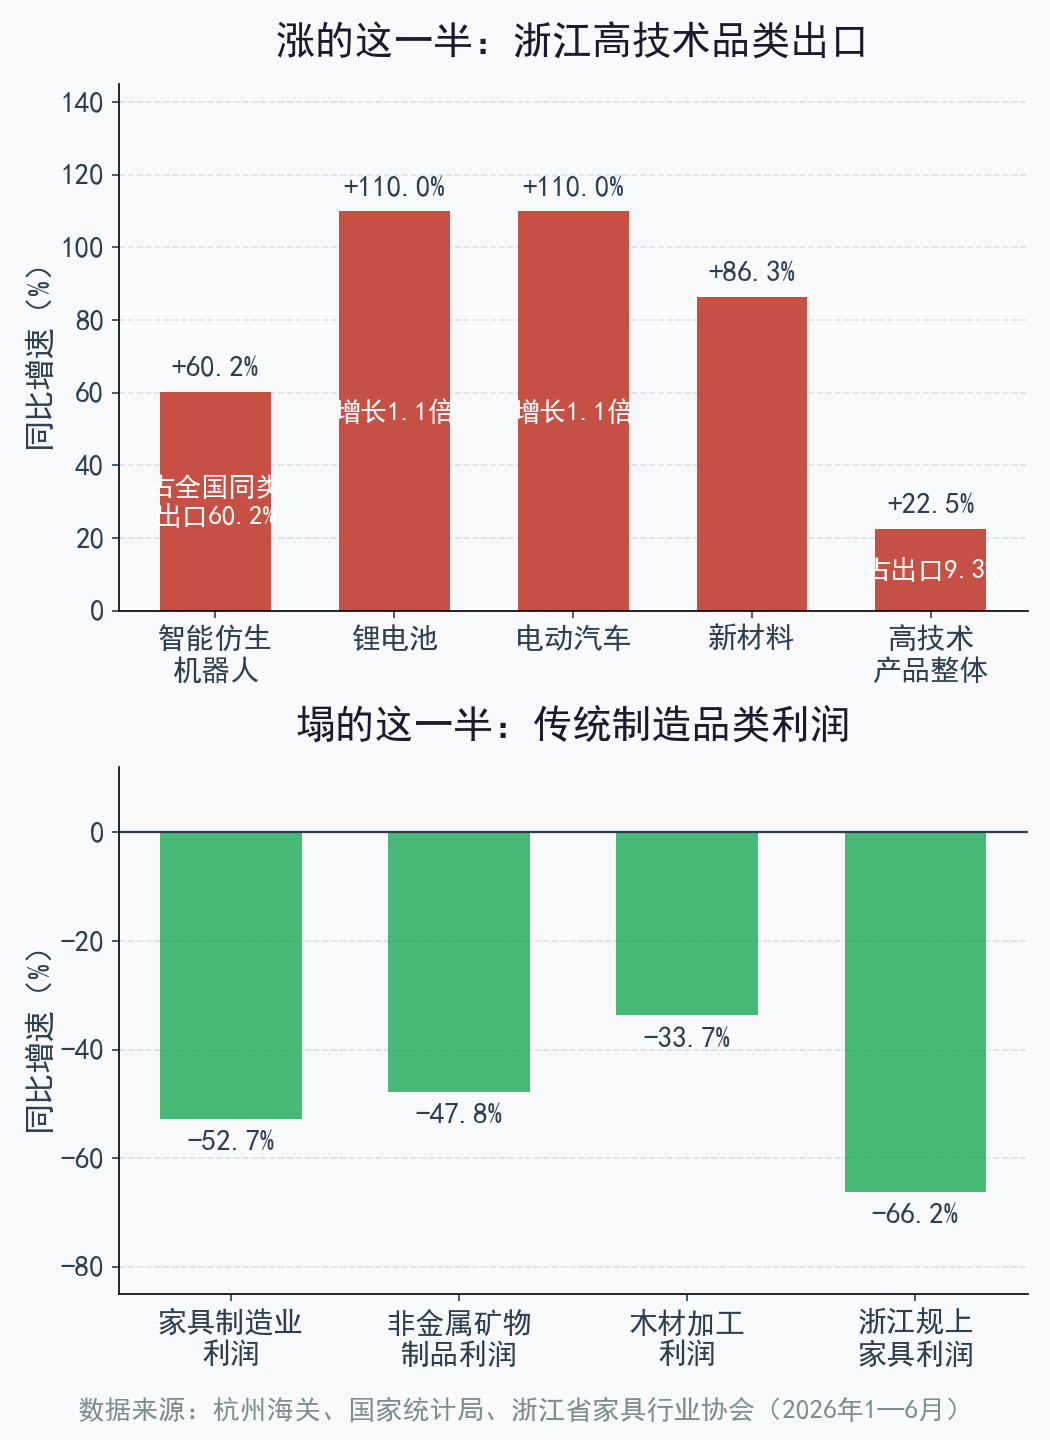
Figure 2: Zhejiang's exports "rose by half" while traditional manufacturing "fell by half" (January-June 2026)
Output increased by 7%, while profit plummeted 66%
A look at the profit statement released by the Zhejiang Province Furniture Industry Association on July 30 is more convincing than any commentary. From January to June 2026, the 1,197 large-scale furniture enterprises in the province achieved a total business revenue of 59.424 billion yuan, representing a year-on-year increase of 2.2%.
Operating costs were 48.608 billion yuan, up 3.7% year-on-year;
Profit and tax totaled 2.715 billion yuan, down 35.8% year-over-year.
Operating profit was 708 million yuan, down 66.9%.
Net profit totaled 793 million yuan, down 66.2%.
Taxes totaled 1.922 billion yuan, up 2.1%.
Pay attention to the tax column.
Profits fell by two-thirds, while taxes rose 2.1%.
The fees line deserves closer scrutiny.
Selling expenses were 2.899 billion yuan, down 2.1% year-over-year;
Management expenses were 3.96 billion yuan, up 0.9%.
Research and development expenses were 2.023 billion yuan, up 0.3%.
Financial expenses were 1.024 billion yuan, up 282.8%.
282.8%. The financial expenses of a furniture factory have nearly tripled, which can be attributed to a few factors: loan interest, exchange losses, and increased funding turnover costs due to extended payment terms.
In the first half of the year, the ex-factory price of industrial products in Zhejiang rose by 0.6%, while the purchase price of industrial producers increased by 2.5%. The 1.9 percentage point difference in between is stuck in the gap where ex-factory prices cannot rise and raw material prices cannot be suppressed.
Looking at the product structure, provincial wooden furniture output reached 29.3564 million pieces during the same period, down 7.8% year-on-year.
Upholstered furniture 10.2771 million pieces, down 6.23%;
Metal furniture: 72.79 million units, up 5.4%.
Total output reached 154 million units, up 7.0%.
Metal furniture, with its low unit prices and thin margins, is on the rise. Wooden and upholstered furniture, the high-priced categories that were once the biggest moneymakers, is on the decline. Output is up, but value is down.
The other end of the terminal was also not giving face. The national building materials and home furnishings prosperity index was 113.34 in June, down 16.34 points month-on-month and 2.80 points year-on-year. From January to June, the cumulative sales of national building materials and home furnishings stores above the designated size totaled 664.037 billion yuan, down 4.39% year-on-year.
Domestic furniture cumulative exports reached 243.7 billion yuan, with an overall decline of 0.8%.
Export delivery value of furniture enterprises above designated size in Zhejiang reached 22.641 billion yuan, down 0.3% year on year.
The average number of employees was 176,000, down 0.7% year-on-year.
The decline is modest—and the figure should be read the other way. It shows most factories are still holding on, not resorting to mass layoffs, but simply halting hiring and backfills. The ones that truly couldn't hold on are the ones that shut down and no longer appear in the statistics at all.
Looking at the bigger picture, in the first half of the year, profits of China's large-scale industrial enterprises increased by 18.7% year-over-year, while the furniture manufacturing industry saw a decline of 52.7%.
These two sets of opposing numbers come from the same statistical report and are listed right next to each other.
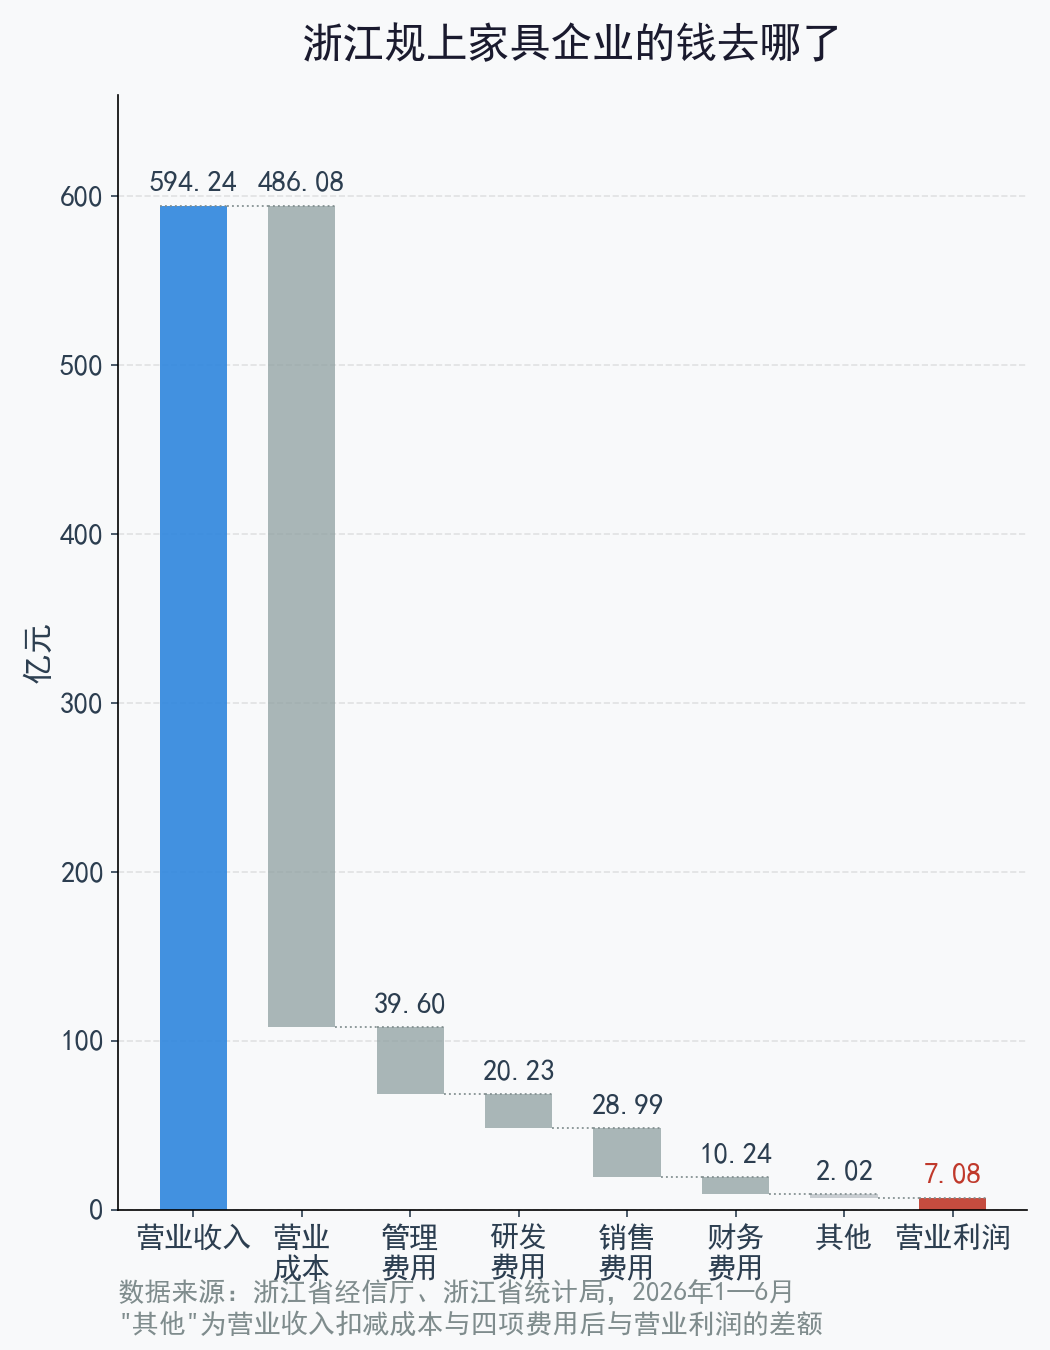
Figure 3: Revenue penetration of 1,197 above-scale furniture enterprises in Zhejiang (January-June 2026, in billion yuan)
The tertiary sector accounts for 60% of the economy, so why are wages still stagnant?
There's a popular notion that the secondary industry is affected by tariffs and domestic demand, but since the services industry price index is rising, wages should also increase accordingly.
First, let's lay out the structure of the three regions.
In the first half of 2026, Jiangsu's gross regional product was 70,387.3 billion yuan, with the value added of the primary industry at 1,930.7 billion yuan, the secondary industry at 29,520.6 billion yuan, and the tertiary industry at 38,935.9 billion yuan, accounting for 2.7%, 41.9%, and 55.3% respectively.
Zhejiang's gross regional product was 47,937 billion yuan, with the primary industry at 1,129 billion yuan, the secondary industry at 18,130 billion yuan, and the tertiary industry at 28,678 billion yuan, accounting for 2.4%, 37.8%, and 59.8% respectively.
Shanghai's GDP reached 2.788663 trillion yuan, with the primary sector at 3.576 billion yuan, the secondary sector at 569.666 billion yuan, and the tertiary sector at 2.215421 trillion yuan, accounting for 0.1%, 20.4%, and 79.5% respectively.
The tertiary sector accounting for 60% or 80% is not inherently problematic in terms of structure.
The problem is that the growing part of the tertiary sector has little to do with ordinary workers in the county.
In the first half of the year, Shanghai's tertiary industry increased by 5.9% in terms of added value. The financial industry's added value was 4964.18 billion yuan, up 10.2%; the information transmission, software, and information technology services industry's added value was 3850.95 billion yuan, up 9.1%.
The rental and business services industry was 2302.70 billion yuan, up 5.8%.
In Zhejiang, the situation is similar, with the software and information technology services industry growing 10.0%, the leasing and business services industry growing 10.1%, and the financial industry growing 5.8%.
Finance, software information services, and business services.
The majority of jobs in these three fields are located in Hangzhou Future Science and Technology City, Shanghai Lujiazui, and Nanjing Hexi, rather than in industrial parks on the outskirts of county-level cities.
The service industries in the county include catering, retail, logistics, and auto repair. The prosperity of these industries moves in tandem with the orders received by the neighboring factory, not in opposition to it.
Consumer-side data confirms this.
In the first half of the year, Shanghai's total retail sales of social consumer goods reached 83.1973 billion yuan, a year-on-year increase of 0.7%. From January to July, the cumulative total was 95.2951 billion yuan, a year-on-year decrease of 0.2%, turning negative. Nationwide, the total retail sales of social consumer goods from January to July were 2.87744 trillion yuan, an increase of 1.2%. In the first half of the year, Zhejiang's total retail sales of social consumer goods were 1.9539 trillion yuan, an increase of 3.0%, which is relatively good among the eastern provinces.
Looking at income, from January to June, the per capita disposable income of all residents in Zhejiang was 39,807 yuan, up 5.3% year-on-year, 16,826 yuan higher than the national average, ranking first among all provinces. By source, per capita wage income was 22,119 yuan, growing 5.9%;
Operating net income was 7,074 yuan, up 6.6%;
Property net income was 4,792 yuan, up 1.2%;
Net transfer income was 5,821 yuan, up 4.8%.
Wage income rose 5.9% — a solid figure.
Urban residents' per capita disposable income was 45,324 yuan, with actual growth of 3.5% after deducting price factors, while net property income only rose 1.2%. With no increase in property values, rents, or financial investment returns, the drag on family finances from this aspect has a greater impact on spending power than the numbers on a paycheck.
There is still one more bill that is easily overlooked.
From January to July, national fixed-asset investment fell 6.7% year-on-year, with third-industry investment declining 9.5% and real estate development investment plummeting 19.2%. The contraction in government-led investment suggests that the service sector, which relies on public orders and project supporting services, will also face a tough road ahead.
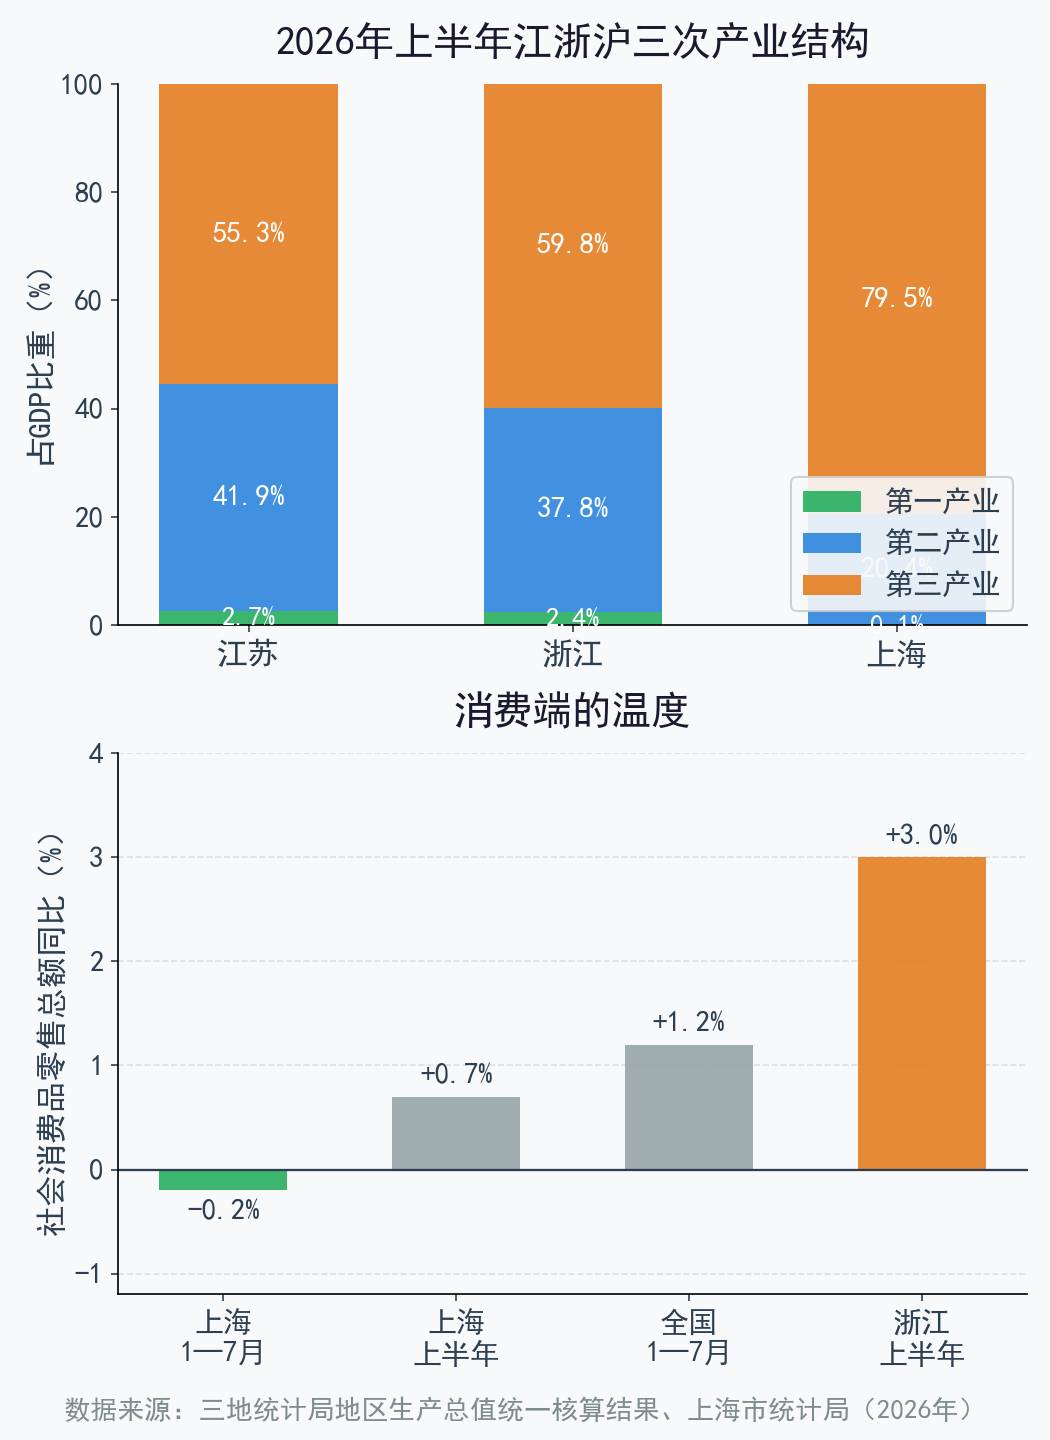
Figure 4: Comparison of the tertiary industry structure and consumption growth rate in Jiangsu, Zhejiang, and Shanghai (January-June 2026)
5. The number of clusters increased by 45% to 160, with Zhejiang and Jiangsu being worlds apart
The economies of Jiangsu and Zhejiang provinces are often mentioned together, but when it comes to industrial clusters, the two are taking different paths.
Zhejiang started with a block economy, and according to data released by the Zhejiang Provincial Department of Economy and Information Technology, 41 cluster core areas and 67 collaborative areas were selected in batches, with county areas and functional zones as the basic units, covering 57 counties and cities and 9 functional zones, and cumulatively cultivating 8 national advanced manufacturing industry clusters and 23 national characteristic industrial clusters for small and medium-sized enterprises.
In 2024, these core and collaborative zones contributed 80 percent of the province's manufacturing investment growth and 90 percent of its industrial growth.
A large quantity does not necessarily mean a high level of technological content.
I've come across a compilation of industrial clusters in Zhejiang's counties, with a total of around 160, of which less than 15% can be considered high-tech.
I was unable to find a publicly available authoritative figure for this number, so it can only be used as a reference.
In the first half of 2026, the equipment manufacturing industry accounted for 53.6% of the added value of scale-above industries in Zhejiang, while high-tech manufacturing accounted for 18.7%. In 2024, 17 key traditional manufacturing industries contributed to more than 60% of the growth of scale-above industries.
Traditional industries contributed to 60% of the growth, but also accounted for the entire decline in profits this round. This is the most painful aspect for Zhejiang - they cannot be abandoned, yet they are too costly to maintain.
Jiangsu's situation is somewhat different. It has fewer industrial clusters, but a notably higher share of technology-focused ones. Even clusters centered on mid- to low-end manufacturing include a significant number of companies positioned as upstream equipment and key technology suppliers.
Taking Suzhou's two county-level units as a comparison is the most intuitive.
In the first half of the year, Kunshan's total output value of industries above designated size reached 635.53 billion yuan, with the electronic information industry contributing 385.26 billion yuan, accounting for a stable share of over 60%. Actual foreign investment usage totaled 660 million U.S. dollars, up 14.2% year-on-year, with 61 foreign-funded enterprises choosing to increase their capital. The output value of high-tech enterprises as a share of industries above designated size has risen to 51.8%. The city's strategy is to build intelligent computing into infrastructure, with intelligent computing capacity approaching 30,000 PFLOPS, and 37 leading Taiwan-based enterprises have already positioned themselves in new AI tracks.
Wujiang is taking a different path.
Without a strong foundation of foreign capital, the backbone is composed of domestic private enterprises, with over 6,200 textile companies covering the entire industry chain. Hengli Group achieved revenue of 899 billion yuan in 2025, expanding from refining and petrochemicals to textiles and heavy industry, and also led the establishment of the National Advanced Functional Fiber Innovation Center.
Two paths, one common thread: both push existing industries deeper into technology rather than switching tracks.
Looking back at Hangzhou.
DeepSeek, Unitree Robotics, DEEP Robotics, Game Science, Manycore Tech and BrainCo — six companies with an average age of under 10 years — span sectors from large language models and robotics to 3A games and brain-computer interfaces. In 2025, they went from breaking into the mainstream to seeing three of the six launch IPO processes.
Many people view "Hangzhou's Six Little Dragons" as a successful case of city marketing.
I think this reflects a major manufacturing province's understanding of its own industrial structure.
Zhejiang has 130,000 tech-oriented small and medium-sized enterprises, 60,700 industrial firms above designated size, 47,500 national high-tech enterprises, and 1,801 "little giant" firms specializing in niche sectors. The base is solid, yet high-tech manufacturing still accounts for only 18.7% of the province's industrial output above designated size.
There's no need to rush into investing in new things, what else can be done.
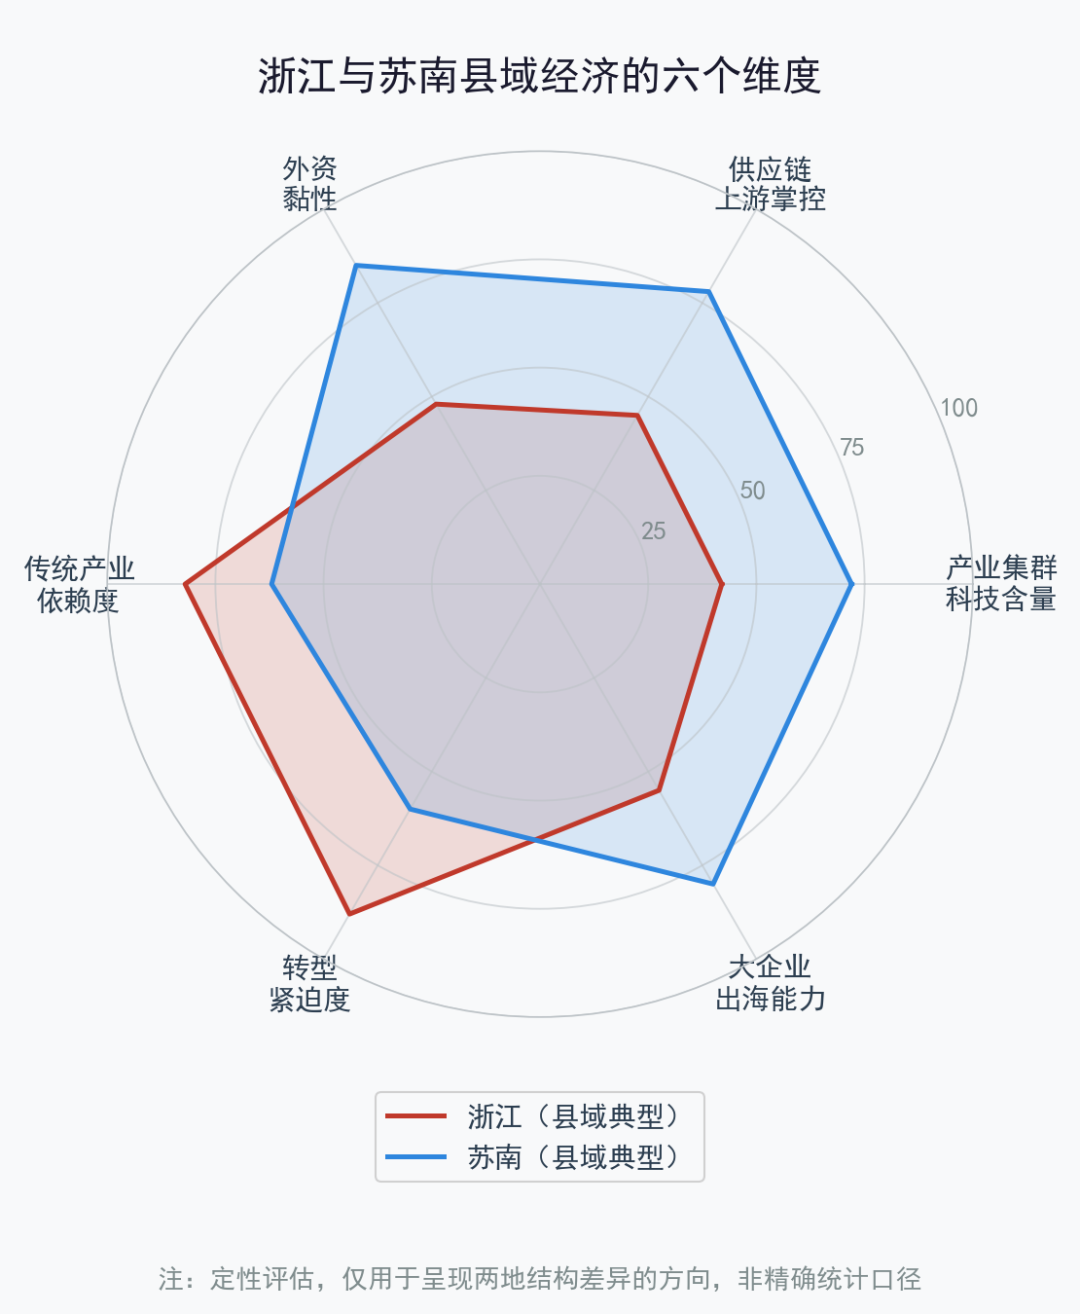
Figure 5: Comparison of Six Aspects of County-level Economies in Zhejiang and Sunan (Qualitative Assessment)
6. The Profit Situation of Four Types of Companies, and My Assessment
When these numbers are strung together, they roughly reveal the order of the situation of enterprises in different sectors of Jiangsu and Zhejiang counties: traditional foreign trade processing was hit the hardest, followed by e-commerce and domestic sales-driven businesses, then local service industries, while the emerging manufacturing sector is actually expanding.
This ranking isn't from the statistics bureau — I pieced it together from available industry data and county-level field research as a qualitative read. It's only useful for gauging the general direction.
The question: Have wages in small county towns across Jiangsu, Zhejiang and Shanghai collapsed?
My response did not crash, but it did freeze.
The per capita disposable income of residents in the province was 39,807 yuan, up 5.3%, still ranking first among all provinces and regions in the country;
Wage income was 22,119 yuan, up 5.9%;
The average surveyed urban unemployment rate stood at 4.7%, below the national average.
These numbers do not support the notion of a "collapse".
What has truly changed is the source of growth.
In the same period, Zhejiang's industrial value added above designated size grew 8.0%, with high-tech manufacturing up 16.2%, core digital economy manufacturing up 15.5%, and equipment manufacturing up 13.1%. Among pillar industries, automobiles and computer/communications electronics grew 21.6% and 19.7%, respectively.
During the same period, total profits in the furniture manufacturing industry fell 52.7%, the non-metallic mineral products industry declined 47.8%, and the wood processing industry dropped 33.7%.
Growth hasn't stopped, it has just shifted to a different area.
What makes the transition period most painful is precisely the majority who remain on the old track without the ability to switch lanes. Their salaries haven't been cut, but they've stopped rising. Their factories haven't shut down, but they've stopped hiring.
This state is more difficult to detect than a collapse.
The statistical reports show a trend of "stable progress", while the industry landscape is undergoing a silent shift.
There's another point worth clarifying. The counties that withstood the squeeze in this round have a common characteristic: either they established their industries in the upstream of the supply chain early on, or they placed heavy-asset infrastructure at the forefront, allowing enterprises to develop new businesses on their own.
Kunshan utilized $660 million in actual foreign investment in the first half of the year, up 14.2% year on year, with 61 foreign-funded enterprises expanding their capital commitments. That wasn't driven by salesmanship — it was anchored by hard assets like nearly 30,000 PFLOPS of intelligent computing capacity.
Conversely, sectors that only do contract manufacturing, compete purely on price, and rely solely on traffic dividends feel the same whether they're in Zhejiang or southern Jiangsu.
At this point, I must admit that transformation has no quick fix.
Vietnam's wood and wood product exports reached $8.6 billion in the first half of the year, up 4.9% year over year. U.S. imports of home textiles from January to May fell 12.7% from a year earlier — market share like that won't be won back overnight.
On August 20, the quote was $10,200 for a 40-foot container.
It is said that there may be another price increase notice before the ship sets sail on September 1.
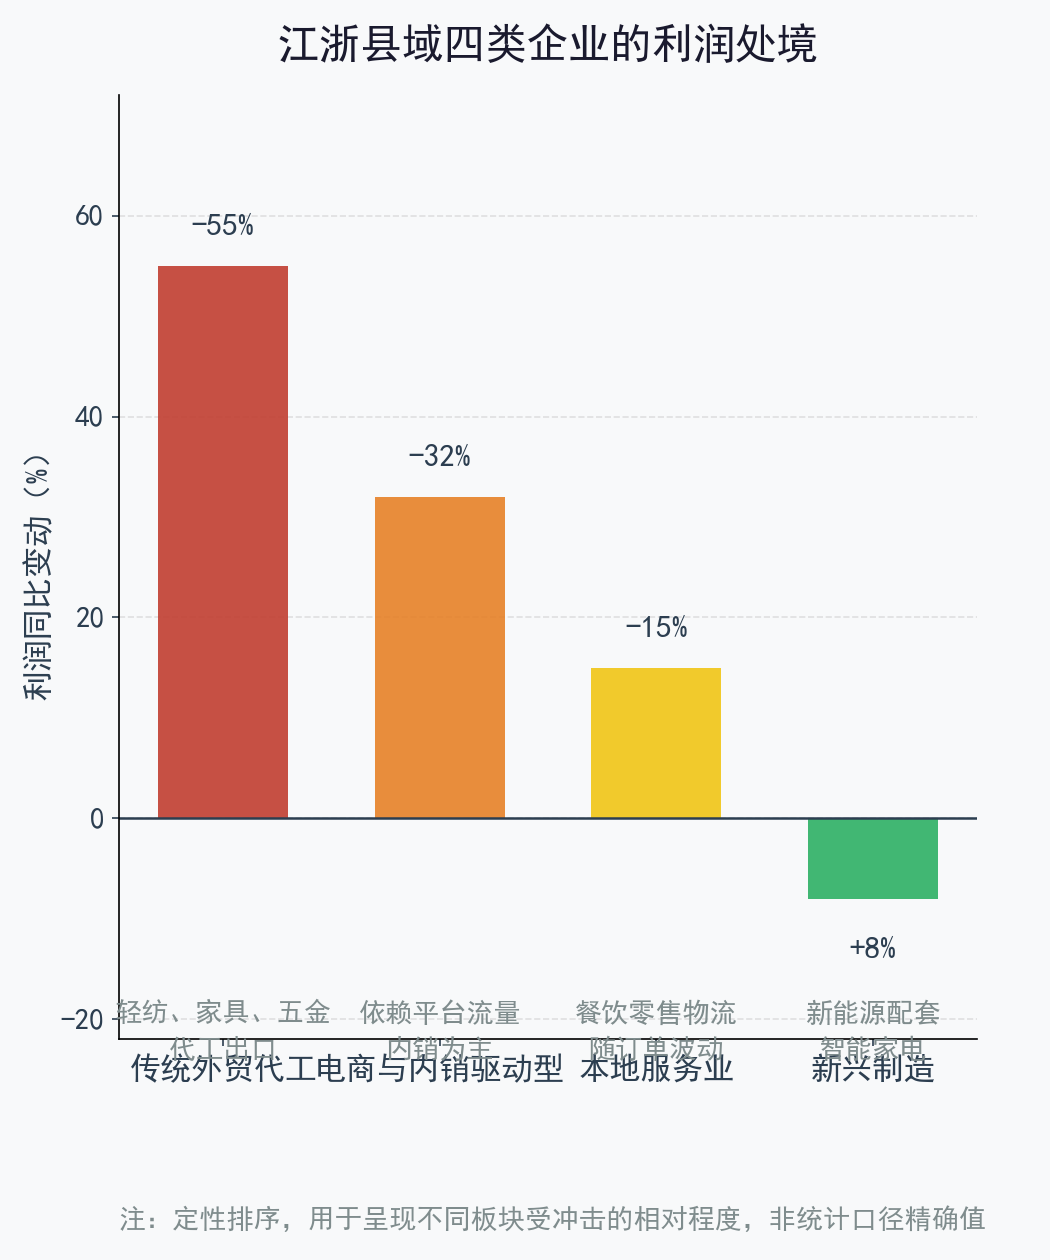
Figure 6: Qualitative ranking of profit positions of four types of enterprises in Jiangsu and Zhejiang counties
Risk Alert
Data Source Appendix
Container freight rates: Shanghai Shipping Exchange's SCFI, as of August 21, 2026; quotes for Shanghai to Jeddah route according to a report by Daily Economic News on August 24, 2026.
Industry profits: according to the National Bureau of Statistics' "Profits of National Scale Industrial Enterprises from January to June 2026" and data released by the Zhejiang Province Furniture Industry Association on July 30, 2026.
Foreign trade data: Hangzhou Customs, General Administration of Customs of China, Digital Economy Laboratory of University of International Business and Economics, "China-US Goods Trade Monthly Monitoring Report (January-June 2026)", China National Household Textile Industry Association.
The Jiangsu Provincial Bureau of Statistics, Zhejiang Provincial Bureau of Statistics, and Shanghai Municipal Bureau of Statistics have released the unified accounting results for the regional GDP and economic operation in the first half of 2026.
Resident Income and Expenditure: National Bureau of Statistics and the National Bureau of Statistics Zhejiang Investigation Team's 2026 First-Half Resident Income and Expenditure Situation.
Industrial clusters: Zhejiang Provincial Department of Economy and Information Technology's "415X" advanced manufacturing industry cluster cultivation project public materials; Kunshan Municipal People's Government's economic operation data for the first half of 2026; Suzhou Municipal People's Government's 2026 government work report.